
Why Polyphosphate Savings Calculations Often Overstate the Real Gain
When you estimate savings from polyphosphate dosing—whether using siliphos crystals, polyphosphate cartridges, or liquid sodium hexametaphosphate—the single most common mistake is tallying the same economic benefit under two or more headings. Scale-prevention savings, reduced chemical consumption, lower energy bills, and extended equipment life all sound impressive on paper, but many of these overlap when polyphosphate is the only treatment in place. Getting the math right matters because inflated projections erode credibility with decision-makers and can lead to under-investment in complementary treatments that genuinely address gaps.
The fix is straightforward: map each claimed saving to one and only one mechanism, then verify that polyphosphate actually delivers that mechanism under your specific operating conditions.
What Polyphosphate Actually Does—and What It Does Not
Polyphosphate compounds, including the glass-like siliphos crystals that dissolve slowly in water, operate primarily through threshold treatment. At low concentrations (typically 1–5 mg/L as PO₄), they interfere with crystal nucleation so that calcium carbonate and other hardness salts stay in solution rather than forming adherent scale. A secondary action is crystal modification: any scale that does form tends to be softer, more easily removed by flow, and less tightly bonded to surfaces.
What polyphosphate does not do is equally important for accurate savings estimates:
- It does not remove hardness from water the way ion-exchange softening does. Total dissolved solids remain essentially unchanged.
- It does not provide disinfection or microbial control.
- It does not reverse existing heavy scale deposits; it slows new formation.
- It does not replace the need for corrosion inhibition in aggressive water chemistries unless specifically formulated and dosed for that purpose.
Confusing these distinctions is where double-counting begins. If you list “reduced water softening chemical costs” as a saving from polyphosphate alone, you are claiming a benefit the chemistry cannot deliver on its own.
The Five Benefit Categories—and Where Overlap Hides
Below is a practical framework for separating genuine, non-overlapping savings from polyphosphate treatment. Use it as a checklist when building a business case.
| Savings Category | Legitimate with Polyphosphate? | Common Double-Count Trap |
|---|---|---|
| Reduced scale-related maintenance (descaling, part replacement) | Yes, if dose is maintained and water chemistry supports threshold effect | Counting this and “extended equipment life” as separate line items when they describe the same outcome |
| Lower energy use from cleaner heat-exchange surfaces | Yes, but only as a downstream effect of scale prevention, not a direct action | Listing energy savings and maintenance savings without noting the causal link, then adding them as independent gains |
| Reduced consumption of acidic or chelating cleaning agents | Yes, if cleaning frequency drops | Also claiming “chemical savings” under a general chemical-cost line that already includes cleaning agents |
| Avoided cost of ion-exchange resin regeneration or salt | No—polyphosphate does not soften; this saving only applies if you replace a softener, not if you add polyphosphate alongside one | Claiming softening savings while also claiming scale prevention savings from the same polyphosphate system |
| Reduced pipe replacement or relining | Partially—long-term benefit but hard to quantify without baseline data | Bundling this with maintenance savings without a clear time horizon, effectively counting capital deferral twice |
How to Build a Non-Overlapping Savings Model
Step 1: Define the baseline you are comparing against
Savings only exist relative to a defined “without treatment” or “with current treatment” scenario. If your facility already uses a low dose of polyphosphate, the incremental benefit of increasing the dose or switching to a siliphos crystal feed system is much smaller than the benefit of adding polyphosphate to an untreated system. State the baseline explicitly.
Step 2: Assign each saving to a single mechanism
For every dollar figure in your estimate, answer one question: “Which specific physical or chemical action produces this saving?” If the answer is “less scale,” that is a mechanism, not a category. Drill down—is it fewer heat-exchanger shutdowns, less acid for cleaning, or lower fuel consumption? Pick one primary expression of that mechanism and document it.
Step 3: Validate the dose-response relationship
Threshold treatment is dose-sensitive. Below a minimum concentration, polyphosphate offers little protection. Above an optimal range, you waste product and may even promote precipitation in some water chemistries. Any savings projection must reference the actual or planned dose and confirm that it falls within the effective window for your source water. Without that confirmation, the numbers are speculative.
Step 4: Separate capital from operating savings
Capital savings (deferred pipe replacement, smaller boiler size) and operating savings (less energy, fewer cleaning chemicals) are real but belong in different sections of a financial model. Combining them obscures payback calculations and invites double-counting when reviewers try to reconcile totals.
Where Siliphos Crystals Fit in the Picture
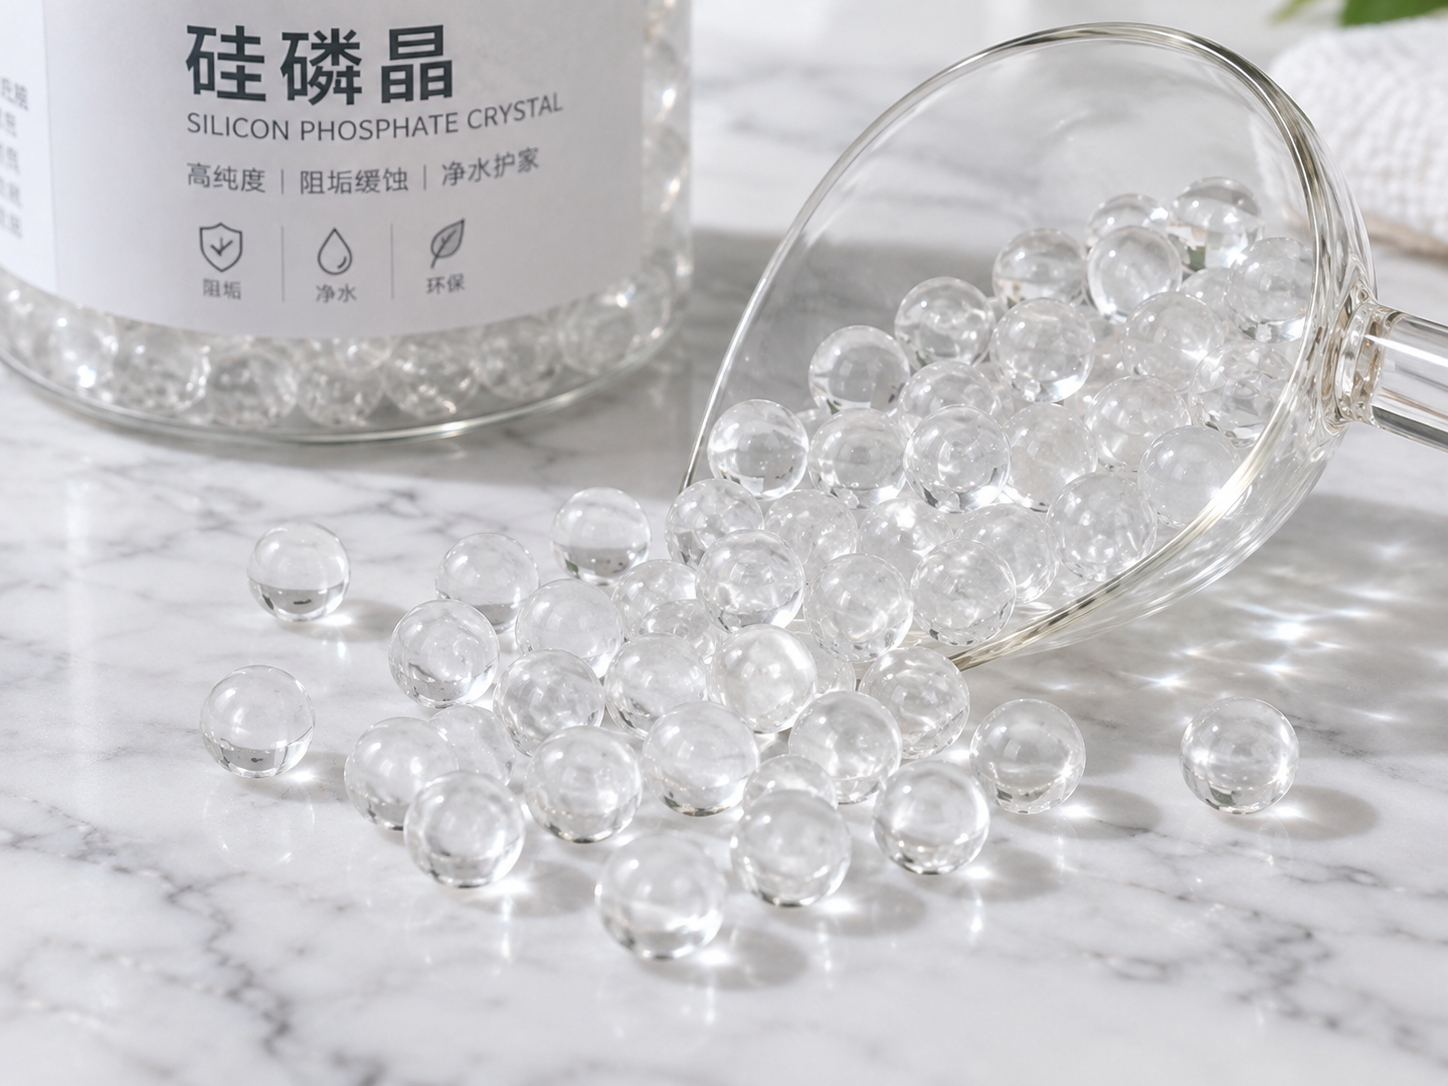
Siliphos crystals—amorphous calcium sodium phosphate glass that dissolves gradually—are one delivery format for polyphosphate. Their slow-release characteristic can simplify dosing control compared with liquid or powdered forms, because the dissolution rate is relatively stable across a range of flow conditions. This can translate into more consistent threshold concentrations and, in turn, more predictable scale prevention.
From a savings perspective, the crystal form does not change the fundamental economics of polyphosphate treatment. It may reduce dosing equipment complexity or labor for make-up, which is a genuine operating saving—but only if your current system requires frequent manual adjustment. Do not inflate this into a “reduced chemical cost” claim unless you can demonstrate that the crystal format uses less active polyphosphate per unit of scale prevention than your current method.
What you must confirm before including siliphos or any polyphosphate product in a savings model:
- The product is approved for your intended application (potable vs. industrial, specific temperature and pH range).
- The local regulatory framework permits polyphosphate dosing at the planned concentration.
- The source water’s hardness, alkalinity, and silica levels are compatible with threshold treatment—very high hardness or very low alkalinity can diminish effectiveness.
- The system design (contact time, feed point, mixing) supports the dissolution and distribution needed for consistent dosing.
Common Questions When Estimating Polyphosphate Savings
Can I count both energy savings and maintenance savings from the same scale-prevention effect?
You can, but only if you treat them as separate line items that share a single root cause. In a transparent model, you would show: “Scale prevention → 15% fewer shutdowns (maintenance saving) + 8% lower fuel use (energy saving).” The total is the sum of two distinct cost centers, not two independent benefits. If you instead list “total operational improvement” and then break it into both categories without the causal link, reviewers may flag it as double-counting.
Does switching from liquid to siliphos crystal polyphosphate automatically generate savings?
Not automatically. Savings depend on whether the crystal format reduces waste, simplifies dosing hardware, or lowers labor in your specific installation. If you are already metering liquid polyphosphate accurately, switching formats may yield minimal economic benefit even if it improves operational convenience.
What if my water also needs corrosion control?
Polyphosphate can provide mild corrosion inhibition on ferrous metals by forming a thin protective film, but this is a secondary function and depends heavily on water chemistry. If corrosion control is a primary objective, do not count it as a scale-prevention saving. Treat it as a separate benefit with its own performance criteria—and verify that the product you are evaluating is actually tested and suitable for that role in your water.
How do I avoid overstating savings when I lack historical data?
Use conservative, defensible assumptions. Reference published case data from similar installations rather than projecting best-case outcomes. Clearly label any figure as an estimate and state the assumptions behind it. A model that honestly says “projected 10–20% reduction in descaling frequency, based on comparable systems” is more persuasive—and more accurate—than one that claims 40% without evidence.
Next Steps for a Credible Estimate
The discipline of avoiding double-counted benefits is not about making savings look smaller; it is about making them credible. A well-structured estimate that clearly separates mechanisms, validates dose, and acknowledges limitations will survive scrutiny from finance teams, auditors, and engineering reviewers alike.
If you are evaluating polyphosphate treatment—including siliphos crystals or comparable media—for a specific installation, the most useful next step is to share your source-water profile (hardness, pH, temperature range, flow rate), the equipment or system where the product would be installed, and whether you need the material for scale prevention, corrosion mitigation, or both. With that information, it becomes possible to identify the right specification and to build a savings model that counts each benefit exactly once.
