
Why Occupancy Shifts Distort Polyphosphate Energy-Savings Data
You cannot attribute all observed energy reduction to polyphosphate scale control when building occupancy has changed during the same period. The correct approach is to normalize energy consumption against a usage-driven baseline—such as occupied hours, hot-water draw volume, or cooling-load hours—before comparing pre- and post-treatment data. Only then can you isolate the portion of savings that stems from improved heat-transfer efficiency caused by polyphosphate dosing rather than from fewer people being in the building.
This distinction matters for facility managers, energy auditors, and water-treatment specifiers who are asked to justify the cost of polyphosphate feed systems, including siliphos crystal and related slow-dissolving phosphate media. Misreading the data leads to either inflated savings claims that collapse under scrutiny or, conversely, the dismissal of a genuinely effective treatment.
What Polyphosphate Actually Does in a Water System
Polyphosphates are sequestering agents. They bind calcium and other scale-forming ions in solution, preventing those ions from crystallizing as calcium carbonate or calcium sulfate on heat-exchange surfaces. The result is thinner or absent scale films on boiler tubes, cooling-tower fill, hot-water heaters, and similar equipment.
Thinner scale means higher heat-transfer coefficients. A chiller or boiler that once lost 10–15 % of its rated capacity to fouling can regain most of that capacity once dosing is established. That regained capacity translates into less fuel or electricity per unit of heating or cooling delivered—if the system is actually operating at similar loads.
Polyphosphate treatment is not water softening (which removes hardness), not scale removal (which strips existing deposits), not filtration (which traps particles), and not disinfection or corrosion inhibition in the strict sense, though some formulations include corrosion-mitigating components. Confusing these functions is a common source of error in savings calculations.
How Occupancy Changes Mimic Energy Savings
When a building runs fewer occupied hours, the HVAC system cycles less, hot-water demand drops, and chillers see reduced peak loads. Energy meters record lower kilowatt-hours or therms. If a polyphosphate system was installed around the same time, it is tempting—but wrong—to credit the entire reduction to scale control.
Typical occupancy-driven shifts include:
- Hybrid or remote-work schedules cutting weekday occupancy by 20–50 %
- Seasonal program changes that shorten boiler or chiller run times
- Tenant turnover leaving portions of a building idle
- Pandemic-era or policy-driven occupancy caps that persist
Any of these will lower energy use independently of water chemistry. Without correcting for them, you are comparing two different operating conditions and calling the difference a treatment benefit.
A Practical Framework for Separating the Two Effects
Step 1: Define a Normalized Energy Baseline
Choose a denominator that tracks actual building demand rather than calendar time. Common choices:
- Heating degree-days or cooling degree-days for climate-driven load
- Occupied hours per week for schedules that vary
- Hot-water volume drawn (litres or gallons) for domestic-hot-water systems
- Chiller-load hours at a set threshold for large cooling plants
Express energy use as kWh per occupied hour, kWh per degree-day, or kWh per litre of hot water. This removes most of the occupancy signal from the data.
Step 2: Identify the Pre-Treatment Measurement Window
Gather at least 12 months of utility data before polyphosphate dosing began, normalized as above. Short windows (one or two months) are unreliable because seasonal weather and holiday schedules skew results. If you only have post-treatment data, you cannot separate occupancy from treatment with confidence—acknowledge that limitation rather than guess.
Step 3: Track Dosing and Water-Quality Variables Concurrently
Log polyphosphate feed rate, orthophosphate residual, pH, conductivity, and hardness at regular intervals. Scale-control performance is only plausible when residual polyphosphate is maintained within the manufacturer’s recommended range for the water conditions in question. If residuals were erratic or below specification, any savings are harder to defend.
Step 4: Use a Parallel or Phased Comparison When Possible
The strongest evidence comes from treating one loop or one building while leaving a comparable loop or building untreated. If the treated loop shows lower energy intensity under similar occupancy and weather, the case for polyphosphate-driven savings strengthens considerably. In retrofit projects where parallel comparison is not feasible, statistical regression on normalized data is the next-best tool.
Where Siliphos Crystal and Similar Media Fit
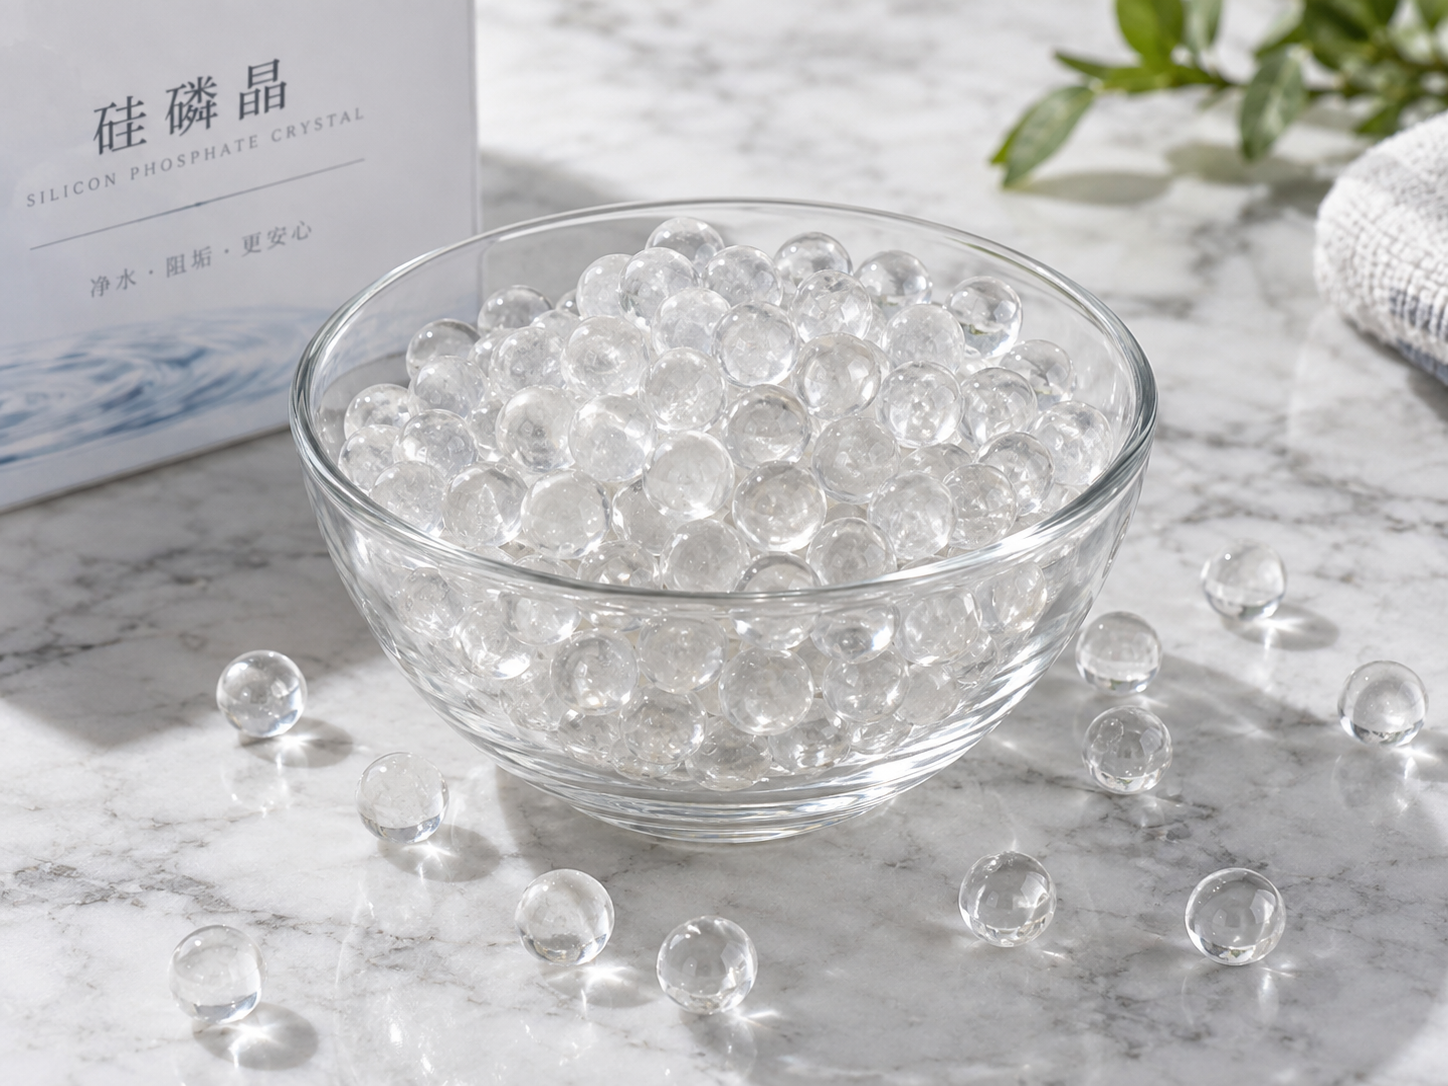
Siliphos crystal is a slow-dissolving polyphosphate-based media used in cartridge or canister housings to provide continuous low-level dosing. Because it dissolves gradually, it maintains a steadier residual than batch-fed liquid polyphosphate in some small-to-mid-scale applications, such as commercial boilers, point-of-entry domestic-water treatment, or supplemental dosing on recirculating loops.
When evaluating energy-savings potential for siliphos crystal or comparable phosphate-crystal products, keep these points in mind:
- The product must be dosed at a level proven to control scale under your specific water hardness, temperature, and pH. Underdosing yields no measurable heat-transfer benefit.
- Savings accrue over weeks to months as existing scale softens and new deposition slows. Expecting immediate results from day one is unrealistic.
- Media life, replacement interval, and dissolution rate depend on water temperature, flow, and chemistry. These parameters must be confirmed for your application rather than assumed from generic data.
ENVO CHEMICAL supplies siliphos crystal and related phosphate-based treatment media for scale-inhibition applications. Buyers should request product-specific dissolution profiles and recommended dosing ranges matched to their source-water analysis before projecting savings.
Common Mistakes in Savings Calculations
| Mistake | Why It Skews Results | How to Avoid It |
|---|---|---|
| Comparing raw kWh before and after treatment | Ignores occupancy, weather, and schedule changes | Normalize to occupied hours, degree-days, or water volume |
| Assuming all scale-related savings are permanent | Scale can redevelop if dosing stops or water changes | Monitor residuals and schedule periodic inspection |
| Crediting savings to polyphosphate without measuring residuals | You cannot prove the chemistry was active | Keep log of orthophosphate or polyphosphate residuals |
| Using a single month of post-treatment data as proof | Too short to filter out noise | Use 6–12 months minimum, ideally with a pre-treatment baseline |
| Conflating corrosion inhibition with scale control savings | Different mechanisms, different verification methods | Separate corrosion coupons or Langelier index data from energy metrics |
Frequently Asked Questions
Can I claim energy savings from polyphosphate if I have no pre-treatment data?
Not with confidence. You can note an observed reduction and hypothesize that scale control contributed, but you cannot quantify the polyphosphate share without a baseline. Be transparent about the data gap rather than presenting a speculative number as fact.
Does polyphosphate work the same way in all water chemistries?
No. Effectiveness depends on calcium concentration, pH, temperature, alkalinity, and the presence of iron or manganese. A product that performs well at moderate hardness may underperform at very high hardness unless the dose is adjusted. Always match the media or formulation to a verified water analysis.
Is siliphos crystal suitable for drinking-water systems?
Suitability for potable water depends on the exact product specification, local regulations, and the destination market. Describing a material as food-grade or NSF-listed is a starting point, not a blanket approval. Confirm compliance for your specific jurisdiction and application before installing it on any drinking-water line.
How long does it take to see energy improvements after starting polyphosphate dosing?
Existing scale softens gradually. Noticeable heat-transfer recovery typically appears over several weeks to a few months, depending on system temperature, flow velocity, and the thickness of prior deposits. Dosing must be maintained continuously; interruptions allow scale to rebuild.
What if my building has both occupancy changes and a water-chemistry change at the same time?
This is exactly the problem the title addresses. Use the normalization steps above, and if possible add a second variable you can hold constant—such as running the same chiller plant for both periods. The more independent variables you can control or account for, the clearer the attribution.
Get the Right Media for Your Evaluation
If you are planning a polyphosphate-based scale-control program and need to project realistic energy outcomes, the first step is grounding your expectations in your actual water conditions and occupancy patterns—not in generic savings percentages. ENVO CHEMICAL can help you select siliphos crystal or a comparable phosphate-crystal product matched to your system parameters.
To start, share your source-water analysis (hardness, pH, temperature, iron/manganese if present), the equipment type you plan to protect (boiler, chiller, hot-water heater, etc.), your typical operating flow and temperature, the target dosing format (cartridge, canister, or bulk feed), and your destination market so we can confirm regulatory fit. With that information, we can discuss product options and the performance data you need for a credible savings case.
