
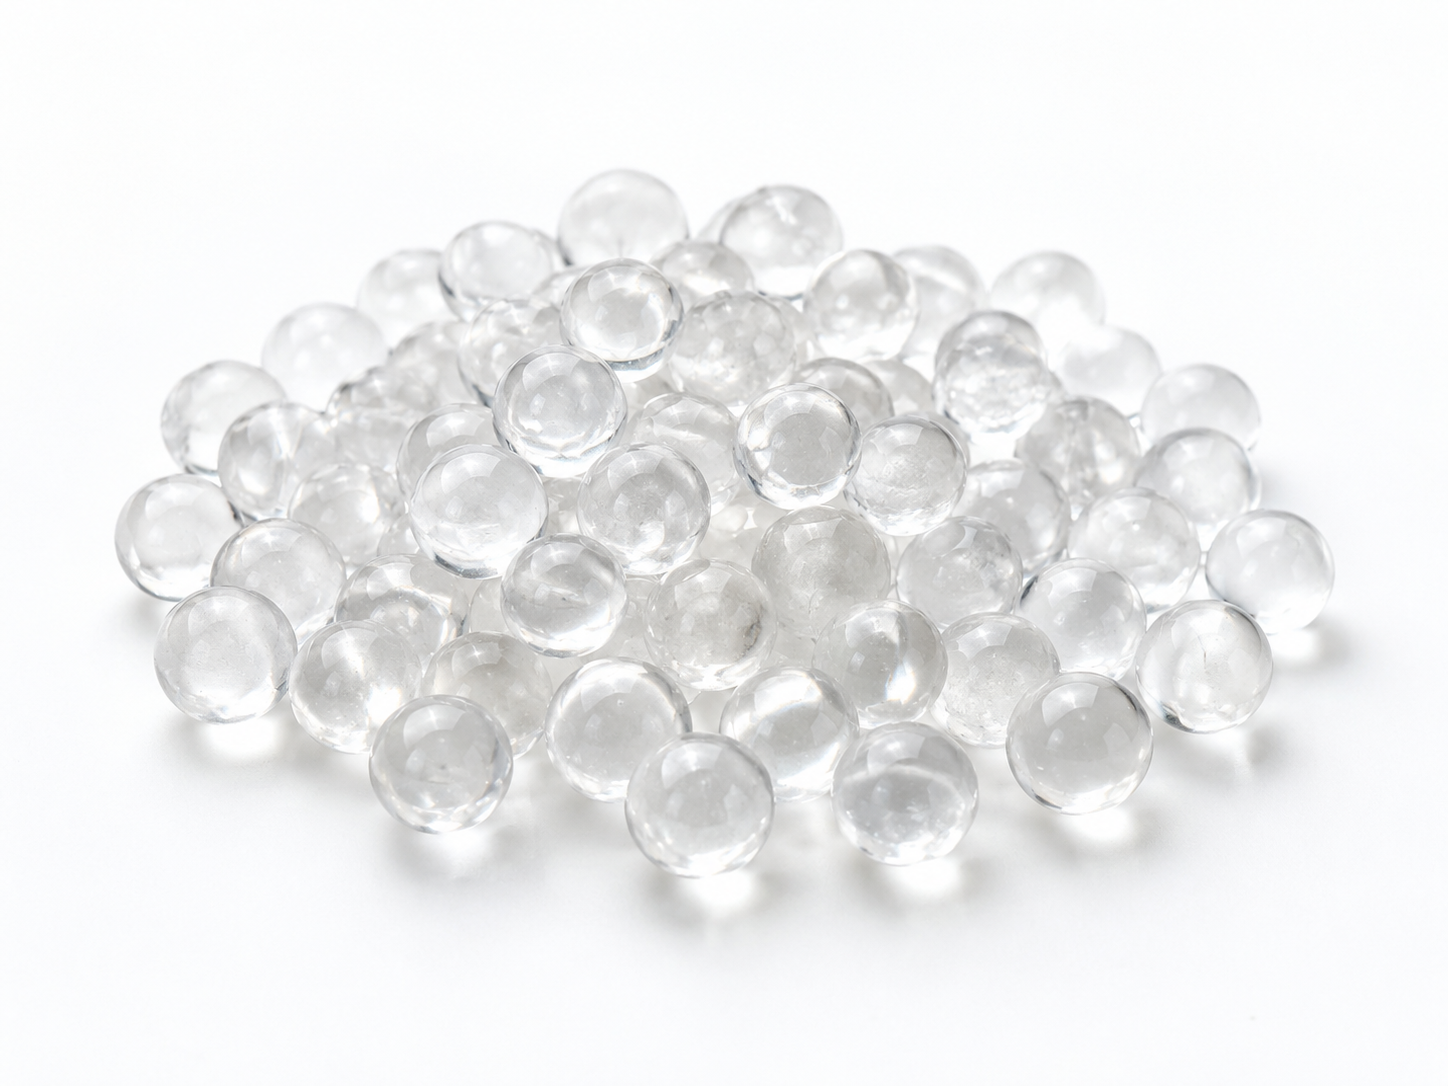
Trending polyphosphate dissolution starts with a definition, not a spreadsheet
If you operate a cartridge, feeder, or contact bed filled with polyphosphate crystal, the practical answer is this: you cannot wait for a lab result to cross a specification limit, because by then the material may have been dosed into equipment, a distribution line, or a downstream process for days or weeks. Instead, you convert each measurement into a normalized rate — the amount of phosphate released per unit of water treated, under comparable conditions — and watch the direction and slope of that rate. A slow, consistent drift is your early warning. A single out-of-limit number is a failure you are already reacting to.
This article is written for filter and cartridge manufacturers, water-treatment equipment builders, importers, distributors, and plant engineers who buy or specify polyphosphate crystal media (often marketed under names such as siliphos) and who need a defensible way to track dissolution performance over the life of a fill.
Be precise about what “dissolution” means for your product
Polyphosphate media work by slowly releasing phosphate species into the water passing over them. That release can be measured in several different ways, and the results are not interchangeable:
- Total phosphate — everything present after a digestion step, usually reported as PO₄ or as P. This is the most common measurement for grading dissolution.
- Orthophosphate — the simple, fully hydrated form. Polyphosphate glasses hydrolyze toward orthophosphate over time and with temperature, so the orthophosphate share tends to rise as the medium ages.
- Acid-hydrolyzable phosphate — the difference between total and orthophosphate, roughly indicating how much of the released phosphate is still in the condensed (polyphosphate) form.
- P₂O₅ equivalence — a reporting convention used in product data sheets. If your specification is written in P₂O₅ and your lab reports PO₄, convert consistently or your trend line is meaningless.
Whatever you choose, fix the unit, the analytical method, and the sampling point in writing before you start collecting data. Changing the method halfway through a fill invalidates the trend.
Dissolution is not softening, scale removal, or filtration
It is worth stating plainly, because the terms are mixed up constantly in purchasing conversations:
- Scale inhibition — a small phosphate residual interferes with calcium carbonate crystal growth, so hardness stays in the water but deposits less readily on hot surfaces.
- Softening — hardness ions are actually removed, normally by ion exchange. Polyphosphate crystal does not do this.
- Scale removal — dissolving existing deposits. That is a different chemical objective and a different product category.
- Corrosion inhibition — forming a thin protective film on metal surfaces. Some phosphate-based materials are used this way, but the mechanism and the required residual are application-specific.
- Filtration — physical removal of particulates. A polyphosphate cartridge may contain a filter element, but the phosphate release and the filtration are two separate functions.
Trending dissolution tells you about dosage. It does not tell you whether the water is softened, whether scale was removed, or whether the water is safe to drink.
Why a pass/fail result cannot protect you
Specifications are usually written as a range: a target residual, or a release rate per unit volume, with an upper and lower bound. Three things go wrong with pass/fail checking:
- You sample too rarely. If you test monthly and the release rate is falling steadily, you learn about the failure after it happens.
- You lose the reason. A number outside the range does not tell you whether the medium is exhausted, the water got warmer, the flow changed, or the analytical method drifted.
- You cannot plan replacement. Without a slope, you cannot estimate remaining service life, so you either replace early and waste media, or late and risk a compliance issue.
Build the baseline before you need the trend
1. Translate the specification into your own measurement units
Take the limit that actually matters — a product datasheet value, a customer requirement, an internal release target, or a regulatory limit in the destination market — and restate it in exactly the units and method your lab will use. Confirm with the material supplier what the published figure is based on: laboratory batch test, standard test method, or field experience under defined conditions. A number without its test conditions cannot be compared to your field data.
2. Normalize every result
Raw concentration is a poor trending variable because it responds to operating conditions as much as to the medium. Normalize at least for these:
| Factor | Why it changes the reading | How to handle it |
|---|---|---|
| Water temperature | Higher temperature accelerates hydrolysis and generally raises release rate | Record temperature at every sample; compare like with like, or apply a documented correction |
| Volume treated / flow | More water passing through means more total phosphate released | Report per unit volume (for example, mg PO₄ per litre treated, or mass released per m³) |
| Contact time | Longer contact dissolves more material | Log flow rate and bed or cartridge geometry; treat flow changes as a separate variable |
| Media mass remaining | Surface area and inventory shrink as the fill is consumed | Note the fill date, initial charge mass, and any top-ups |
| pH and alkalinity | Affect both dissolution and phosphate speciation | Measure at the same point, at the same time of day, with the same method |
| Sampling point | Upstream versus downstream, or a stagnant line, changes the result | Fix one sampling point and one purge procedure in the written protocol |
3. Collect enough points to see a line, not a scatter
During the first fill, take more frequent samples than you think you need, and keep collecting until you have a stable baseline period. Only then set your internal action levels. An action level placed inside the specification limit — closer to the target than to the boundary — gives you time to investigate. The exact margin depends on your sampling frequency and how fast the process can change; justify it from your own data rather than adopting a number from someone else’s system.
Leading indicators worth tracking
Trending works best when you track more than one variable, because different variables fail at different speeds.
| Indicator | What it tells you | Early warning pattern |
|---|---|---|
| Normalized release rate | Overall dosage performance of the fill | Gradual downward slope over successive sampling intervals |
| Orthophosphate fraction | Degree of hydrolysis and aging of the medium | Steady rise relative to total phosphate |
| Mass balance (phosphate out vs. media consumed) | Whether release is consistent with inventory loss | Release falling faster than the recorded mass loss |
| Temperature-normalized rate | Performance with the seasonal temperature effect removed | Drift that persists after normalization |
| Downstream effect (scaling or corrosion indicators) | Whether the release is still achieving its purpose | Protection indicators degrading while dosage still looks acceptable |
A workable trending routine
- Write the protocol. Sampling point, purge time, container, preservation, analytical method, units, and reporting form.
- Record operating conditions with every sample. Temperature, flow or volume treated since last sample, pH, and anything unusual.
- Convert to normalized units immediately. Do not store raw concentrations and normalize later; that is where errors accumulate.
- Plot against cumulative volume treated, not just calendar time. A fill that treats little water in a month has not aged the same way as one that treats a great deal.
- Apply two sets of limits. An internal action level for investigation and the true specification limit for compliance.
- Review the slope, not just the latest point. Compare the most recent interval against the previous several intervals.
- Re-baseline deliberately. After a media replacement, a flow change, or a source-water change, start a new baseline segment rather than drawing one line through incompatible data.
Signals that a specification breach is approaching
- Three or more consecutive intervals moving in the same direction, even if each individual result is still within range.
- A normalized rate that has fallen by a meaningful fraction of the baseline value without an operating explanation.
- Orthophosphate share climbing while total phosphate holds steady — the medium is aging, and the performance characteristic your application depends on may change before the total number does.
- Increasing variability between samples taken under nominally identical conditions. Rising scatter often precedes a shift in the mean.
- A downward step change that coincides with a flow increase, a temperature change, or a partial refill — check the operating record before blaming the medium.
Mistakes that hide a rising trend
- Sampling stagnant water. Water sitting in a line or housing for hours can read very differently from flowing water.
- Mixing analytical methods. Different phosphate methods have different recoveries and different selectivity between ortho- and condensed forms.
- Averaging across seasons. A temperature-driven summer peak can mask a genuine downward drift in the underlying material performance.
- Ignoring media inventory. A fill that has been topped up is not the same material population as the original charge.
- Treating a datasheet value as a field prediction. Published dissolution data are generated under defined conditions. Your field conditions are almost certainly different, so use published figures to set the starting expectation, then replace them with your own baseline.
- Assuming all polyphosphate crystals behave alike. Products sold as siliphos, phosphate crystal, or polyphosphate media can differ in composition, form, and intended application. Do not carry a trend line, a dosing assumption, or a limit from one product to another without verification.
What to do when the trend approaches the limit
First, verify the measurement: re-sample, check the method, and confirm the operating conditions. Many apparent trends are instrument or sampling artifacts. If the trend is real, the options are usually:
- Adjust the operating envelope — for example, reduce flow or change the contact arrangement, if the equipment and the process allow it.
- Replenish or replace the medium early, using the slope to estimate the remaining safe interval rather than waiting for a breach.
- Re-evaluate the specification if the original limit was based on a different product, a different water, or a datasheet condition that never applied to your system.
Record the cause. A trend that is explained and documented becomes useful operating knowledge; a trend that is explained away becomes the next failure.
Frequently asked questions
How often should polyphosphate dissolution be tested?
There is no universal interval. Sample frequently enough that at least two or three results arrive before the trend could reach your action level at its observed rate of change. During a new fill or after any process change, sample more often than steady-state operation requires.
Can I use a conductivity or TDS reading instead of phosphate analysis?
Only if you have verified the correlation for your specific water and product. Conductivity responds to all dissolved ions, so it cannot separate phosphate release from changes in the source water. It can be a useful secondary check, not a replacement for phosphate measurement.
Does a rising orthophosphate share mean the medium has failed?
Not by itself. Hydrolysis to orthophosphate is a normal part of how these materials behave, and the practical significance depends on which function your application relies on. Treat it as an aging indicator and evaluate it alongside the normalized release rate and your downstream performance data.
What if my specification came from a supplier’s datasheet?
Check what test conditions the figure is based on, confirm it applies to the exact product grade you are using, and then establish your own field baseline. Where the datasheet and your field data disagree, the reason is usually a difference in temperature, contact time, water chemistry, or analytical method — not necessarily a material defect.
Is food-grade polyphosphate automatically suitable for drinking water?
No. Food-grade status addresses purity for food contact. Drinking-water suitability depends on the exact product, the dosage applied, the source water, and the regulations of the destination market, and it must be verified for that specific combination. Ask for the relevant documentation for your product and application rather than inferring it from a grade description.
Specifying or replacing polyphosphate media?
If you are setting up a trending program, comparing product options, or troubleshooting a dissolution result that is drifting toward its limit, ENVO CHEMICAL can review the application details with you. Useful information to include: the application and equipment type, source-water characteristics, target residual or release objective, current specification limit and analytical method, operating temperature and flow range, expected quantity, and destination market. With those details, the technical discussion can start from your actual conditions rather than a generic datasheet figure.
