
Why Unsupported Performance Numbers Wreck Polyphosphate Comparison Charts
Polyphosphate comparison charts that throw around unverified performance percentages—such as “98% scale reduction” or “95% corrosion prevention”—give procurement teams and system designers a false sense of certainty. The short answer is this: no credible polyphosphate product specification sheet should rely on single-digit performance percentages unless those figures come from a controlled, third-party test that matches your exact water chemistry, temperature, flow rate, and contact time. Anything less is marketing, not engineering.
Whether you are sourcing siliphos crystal, phosphate crystal media, or other polyphosphate-based scale control products, the comparison exercise only works when every data point is traceable. Below is a practical guide to spotting unsupported claims, choosing legitimate comparison parameters, and asking the right questions before you commit to a supplier.
What “Performance Percentage” Actually Means in Polyphosphate Media
In the context of polyphosphate dosing or media-based treatment, a performance percentage usually refers to one of three things:
- Scale inhibition efficiency—how effectively the polyphosphate sequesters calcium, magnesium, or other scaling ions under specific test conditions.
- Corrosion inhibition rate—the reduction in metal loss (often lead or copper) compared with untreated water.
- Phosphate release consistency—how steadily the product dissolves or releases orthophosphate over its service life.
None of these figures are universal. A polyphosphate crystal that inhibits 90% of calcium carbonate scale at 25 °C and pH 7.5 may deliver far less at 60 °C or pH 8.5. If a comparison chart does not state the test conditions alongside the percentage, treat that number as unsupported.
Common Pitfalls in Polyphosphate Comparison Charts
Missing Water Chemistry Context
A chart that lists “95% effectiveness” without disclosing whether the test water was 150 mg/L CaCO₃ hardness or 500 mg/L, or whether the pH was 6.8 or 8.2, is not comparing apples to apples. Polyphosphate behavior changes dramatically with ionic composition. What works in a soft, low-TDS supply may underperform in hard, high-alkalinity water. Always ask for the full test matrix behind any headline percentage.
Confusing Scale Inhibition with Scale Removal
Polyphosphate is a threshold treatment and sequestering agent. It does not remove existing scale the way a mechanical descaler or acid flush does. Charts that blur the line between preventing new scale and dissolving old scale mislead buyers into expecting results the chemistry cannot deliver. Scale inhibition keeps ions in solution; it does not strip deposits from pipe walls.
Borrowing Data from a Different Product Line
Some suppliers publish comparison charts using test results from a competitor’s product, a different grade of their own media, or an academic study on generic sodium hexametaphosphate. Unless the chart clearly labels the source and the exact product tested, you cannot rely on it for purchasing decisions. Legitimate comparisons require head-to-head testing under identical conditions or, at minimum, side-by-side specification sheets with verified parameters.
Legitimate Parameters for Comparing Polyphosphate Products
Instead of chasing a single impressive percentage, build your comparison around parameters that are measurable, reproducible, and relevant to your installation. The table below outlines what to look for and what to question.
| Parameter | What to Verify | Red Flag |
|---|---|---|
| Active ingredient content | Exact percentage of soluble polyphosphate (e.g., sodium hexametaphosphate, tetrasodium pyrophosphate) per unit weight | Vague “high-purity” claims without a numerical value |
| Dissolution rate | Test data at relevant temperature and flow conditions | Single room-temperature figure applied to all climates |
| Recommended dosage range | Expressed in ppm or mg/L relative to specific hardness levels | One-size-fits-all dosage with no reference to water hardness |
| Service life or replacement interval | Stated in volume of water treated or months of operation, with conditions noted | Generic “long-lasting” without defined endpoint |
| Certification or compliance | Specific standard or regulation (e.g., NSF/ANSI 61 for health effects, or relevant local drinking-water codes) | “Food grade” used as a blanket drinking-water approval |
| Test method reference | Named protocol, laboratory, or published standard used to generate the data | No method cited at all |
How to Evaluate Siliphos Crystal and Similar Media Without Falling for Hype
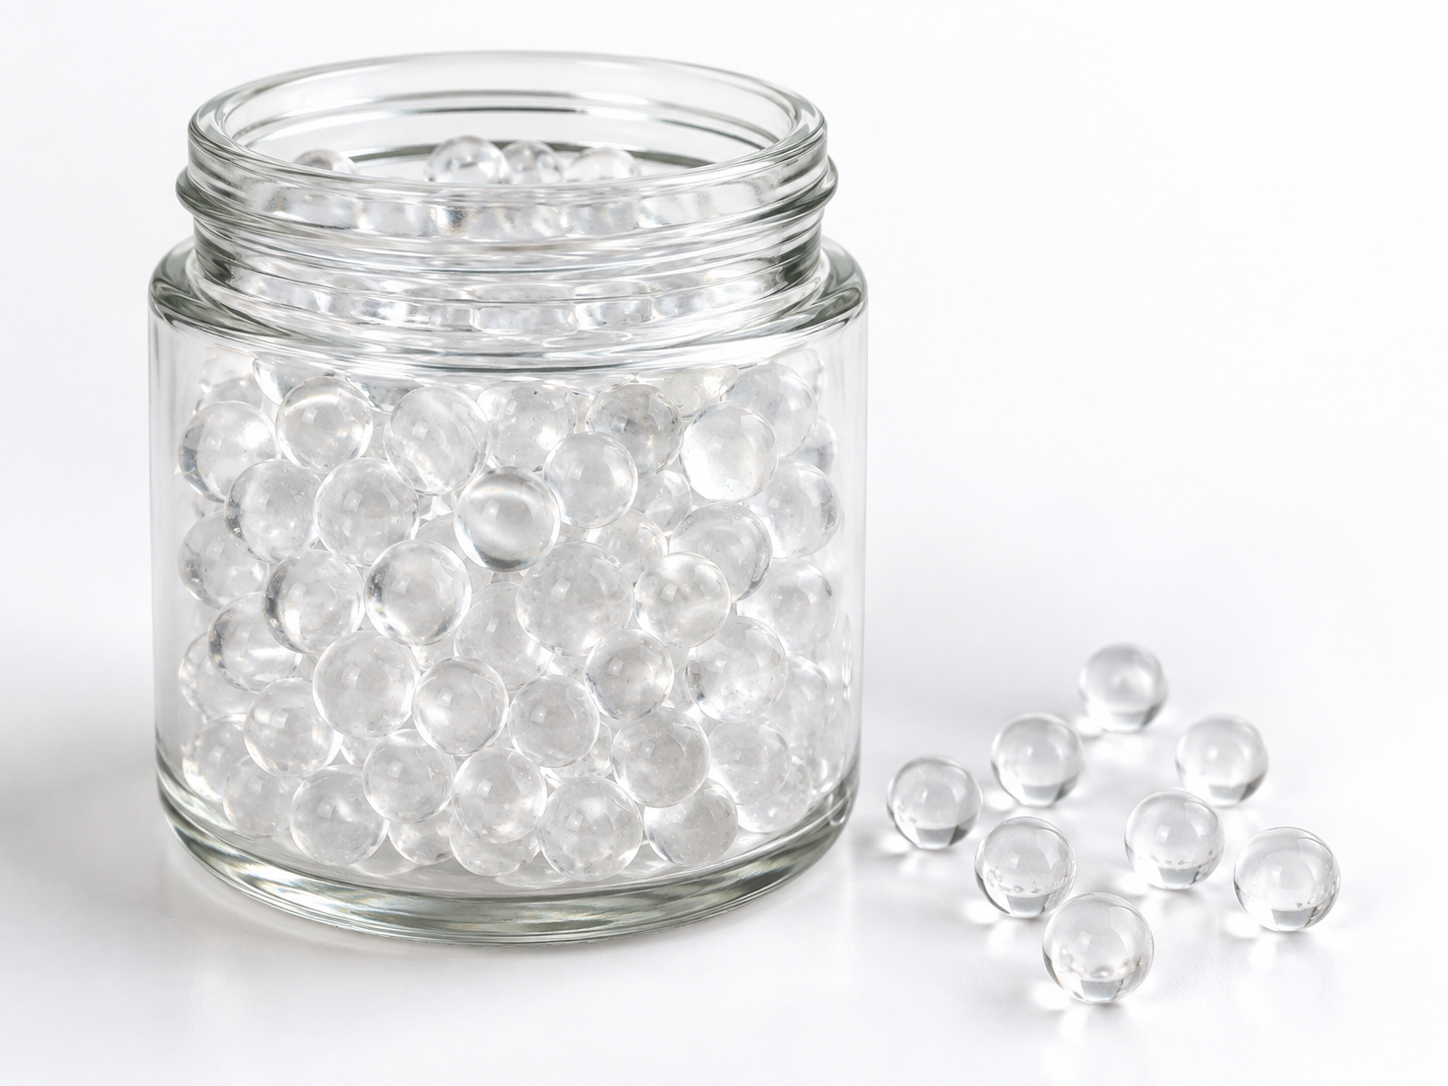
Siliphos crystal and other polyphosphate-releasing media are often sold in granular or beaded form for use in cartridge filters, in-line reactors, or dosing vessels. Their performance depends on contact time, surface area exposure, and the polyphosphate concentration gradient they maintain. Here is a short checklist you can use when a supplier sends you a comparison chart or specification sheet:
- Ask for the raw test report, not just the summary. A summary slide may cherry-pick favorable conditions. The full report shows the methodology and limitations.
- Confirm the product identity. Siliphos crystal is a branded term used by certain manufacturers. Verify that you are comparing the same chemical family and form factor (granule, bead, liquid concentrate) rather than mixing categories.
- Match the test water to yours. If your source water is 300 mg/L hardness at pH 7.8, a test conducted at 100 mg/L and pH 6.5 is not directly applicable. Request or conduct a pilot if the gap is large.
- Distinguish inhibition from softening. Polyphosphate does not reduce total hardness the way ion exchange or reverse osmosis does. It keeps hardness ions from precipitating. If your specification calls for actual hardness reduction, polyphosphate alone will not meet it.
- Check corrosion claims carefully. Corrosion inhibition data is highly dependent on pipe material, water pH, and the presence of other inhibitors. A blanket “99% corrosion protection” figure without context should be disregarded.
What ENVO CHEMICAL Does Differently
At ENVO CHEMICAL, we supply polyphosphate-based water treatment materials including siliphos crystal and related phosphate crystal products. Rather than publishing comparison charts with headline percentages pulled from unrelated tests, we provide product specifications tied to defined parameters and encourage buyers to validate performance against their own water conditions. When you request technical data, we aim to share what we can verify—composition, recommended application ranges, and guidance on pilot testing—and clearly flag any detail that must be confirmed for your specific use case.
We do not claim universal drinking-water suitability based solely on a food-grade designation. Suitability for potable water depends on the exact product, local regulations, dosing levels, and system design. Buyers targeting drinking-water applications should verify compliance with the standards that apply in their destination market before finalizing a purchase.
Frequently Asked Questions About Polyphosphate Comparison Data
Can I rely on a supplier’s internal test results for polyphosphate efficiency?
Internal tests can be useful if the methodology is transparent and the conditions match your application. However, independent or third-party verification adds credibility. Always ask whether the test was conducted in-house, by a contracted lab, or by an accredited body, and what standard (if any) guided the procedure.
Is a higher polyphosphate percentage always better?
Not necessarily. Overdosing polyphosphate can lead to excess orthophosphate in the treated water, which in some systems may promote biological growth or interfere with downstream processes. The optimal concentration is a function of water chemistry and the target application, not a race to the highest number.
Do polyphosphate media charts need to include flow rate?
Yes. Contact time directly affects how much polyphosphate dissolves and how effectively it sequesters scaling ions. A chart that ignores flow rate or hydraulic loading gives you an incomplete picture. Look for data that specifies liters per minute, gallons per minute, or empty-bed contact time.
What if I cannot find any performance data for a product I am evaluating?
Treat the absence of data as a signal to slow down. Request it in writing. A supplier unwilling to share verifiable specifications or test references may not be the right partner for a critical application.
Next Step: Share Your Application Details
If you are comparing polyphosphate media for a specific project—whether it involves a cartridge filter, an in-line dosing reactor, or a central treatment system—the most efficient next step is to tell us your source-water profile, target application, equipment type, and any regulatory requirements. ENVO CHEMICAL can then provide relevant product information and help you determine what verification steps make sense before you place an order.
