
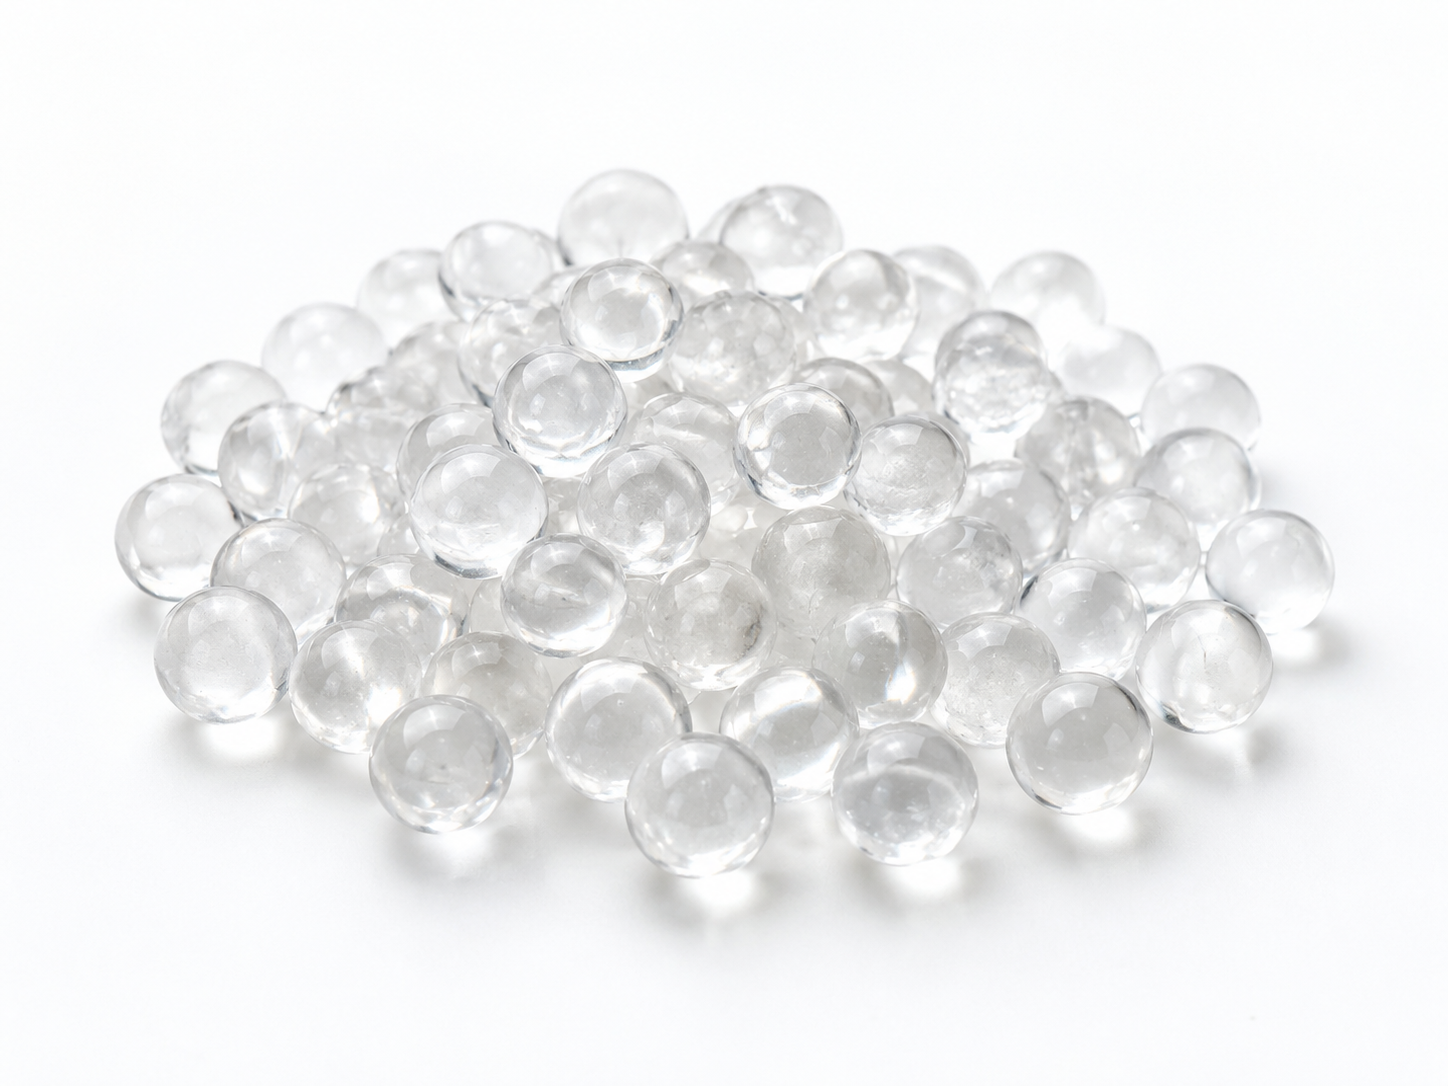
What FTIR comparison can and cannot answer
FTIR answers one question quickly and reliably: are these two polyphosphate materials the same substance, or measurably different? Infrared spectroscopy records how the bonds in a sample absorb light, and phosphate networks produce a distinctive pattern of absorption bands. Two samples from the same production stream normally produce spectra that overlay almost peak for peak; a different chain length, a different cation, a different hydration state, or a filler will usually shift or add bands that you can see without any chemical digestion.
What FTIR does not answer is whether the material will perform the same in service. A spectrum is an identity fingerprint, not a performance prediction. Dissolution rate, bead density, particle size distribution, and the water chemistry of the actual system determine how a polyphosphate media behaves in a cartridge or dosing vessel — and none of those are visible in the infrared fingerprint. Treat FTIR as the first gate in incoming inspection, not the last word.
The bands that carry the useful information
Mid-infrared spectra are normally collected from roughly 4000 to 400 cm⁻¹. For phosphate materials, the diagnostic information is concentrated below about 1300 cm⁻¹, with a broad water band higher up. The table below lists the regions most often examined when comparing polyphosphate media. Exact positions shift with chain length, cation type, hydration, and measurement conditions, so treat these as regions to inspect rather than fixed values.
| Region (cm⁻¹) | Typical assignment | What it tells you about the sample |
|---|---|---|
| 3200–3500 (broad) | O–H stretching | Absorbed or bound water; a quick indicator of hydration differences |
| 1600–1650 | H–O–H bending | Water of hydration, supports the interpretation of the O–H band |
| 1200–1300 | P=O and asymmetric PO₄ stretching | Core of the phosphate network |
| 900–1150 | P–O–P and PO₄ asymmetric stretching | The most informative region for comparing chain length and cation environment |
| 700–800 | P–O–P symmetric stretching | Chain connectivity; changes with degree of condensation |
| 500–620 | PO₄ bending | Low-frequency fingerprint, useful as a confirmation |
| ~1400–1450 and ~870–880 | Carbonate | Surface carbonation, atmospheric exposure, or a carbonate-bearing additive |
One caution: sulfate and silicate absorptions fall in the same 900–1200 cm⁻¹ window as phosphate bands and can overlap or mask them. FTIR is excellent at detecting that something changed; it is weaker at naming an unknown additive without a matching reference spectrum.
ATR or KBr pellet: pick one and stay with it
Both sampling techniques work, but the choice matters more than most people expect, because results from the two are not directly interchangeable.
- ATR with a diamond or ZnSe crystal is the practical choice for routine lot comparison. Preparation is minimal, the sample is recoverable, and turnaround is a few minutes per sample. The trade-off is that contact quality controls the spectrum: coarse or very hard particles give poor contact and a sloping baseline.
- KBr pellet transmission generally gives cleaner band shapes and better library matching, but the grinding and pressing introduce their own variability, KBr is hygroscopic, and hydrated samples can lose or gain water during preparation.
The rule that prevents most bad conclusions: never compare an ATR spectrum from one lot against a pellet spectrum from another. Whichever technique you adopt, use identical grinding, drying, pressure, resolution, scan count, and background conditions for every sample in the comparison set. A difference produced by preparation is indistinguishable from a real material difference unless the method is fixed.
A repeatable comparison workflow
- Define the reference. Retain a spectrum from a lot that performed acceptably in the field, not simply the first lot you received. If you have no performance history yet, retain several lots and build the reference set as data accumulates.
- Sample consistently. Take material from the same position in the packaging, dry or equilibrate all samples under the same conditions, and record that condition.
- Collect with fixed parameters. A common QC setting is 4 cm⁻¹ resolution with 16–32 co-added scans, running a fresh background at the start of each session. The exact values matter less than keeping them constant.
- Correct and normalise uniformly. Apply the same baseline correction and the same normalisation method (for example, normalising on the strongest phosphate band or using vector normalisation) to every spectrum.
- Overlay before you calculate. Visual comparison catches baseline and scattering artefacts that a similarity score can hide.
- Tabulate peak positions. Record the wavenumber of each major band to the resolution your instrument supports, and compare against the reference range.
- Use a similarity metric as a screening tool, not a verdict. Correlation coefficients and hit-quality indices are useful for flagging outliers, but the pass/fail threshold should be derived from your own known-good and known-different pairs, not adopted from a generic figure.
Interpreting the differences you find
| Observation | Plausible cause | Next step |
|---|---|---|
| Markedly stronger, broader O–H band | Higher moisture content or a more hydrated form | Dry both samples identically and re-measure before drawing conclusions |
| New carbonate bands appear | Surface carbonation during storage, or a different additive package | Review storage and packaging; request composition confirmation from the supplier |
| Consistent shift in the 900–1150 cm⁻¹ region | Different chain length, different cation, or a different grade | Compare against reference standards of known grades; confirm with the supplier |
| Baseline rises toward lower wavenumbers | Scattering from particle size or poor ATR contact | Re-grind or re-mount and re-measure before treating it as a material change |
| Sharp extra bands absent from the reference | Additive, contaminant, or a blended product | Attempt library identification, then request a full composition statement |
A useful habit is to photograph or archive the raw spectrum alongside the batch record. When a field complaint arrives months later, the stored spectrum is often the only objective evidence of what was actually supplied.
What FTIR cannot replace
Infrared spectroscopy identifies functional groups. It does not quantify chain-length distribution, cation ratios, or dissolution behaviour. For those, pair FTIR with other methods:
| Method | What it adds |
|---|---|
| Phosphate titration or ion chromatography | Ortho versus condensed phosphate content, which gives an indication of the degree of condensation |
| ICP-OES | Cation content — sodium, calcium, potassium, magnesium — which FTIR cannot quantify |
| XRD | Whether the material is crystalline or a glassy solid, and which crystalline phases are present |
| Bench dissolution test in the intended water | Release rate under realistic contact time, temperature, and water chemistry |
Terminology also needs care. Siliphos is a trade name, and products marketed under it or under similar names are not necessarily chemically identical. Likewise, “polyphosphate media”, “phosphate crystal”, and “siliphos crystal” describe a family of materials rather than a single specification. If you are qualifying an alternative supplier, ask for the composition and grade designation, then verify identity by FTIR against your retained reference.
Keep the functions separate
Polyphosphate media are generally used for scale and corrosion control in water lines, where they interfere with crystal growth and can form a thin protective film on metal surfaces. That is not the same as:
- Water softening, which removes hardness ions, typically by ion exchange.
- Scale removal, which dissolves or dislodges existing deposits.
- Filtration, which physically retains particulate matter.
- Disinfection, which inactivates microorganisms.
A polyphosphate medium does not soften water in the ion-exchange sense, does not remove existing scale, and does not disinfect. FTIR will tell you what the material is made of; it will not tell you whether it is approved for a given use. Drinking-water suitability must be verified for the exact product, the specific application conditions, and the destination market — a “food grade” description alone does not establish it.
Frequently asked questions
Can FTIR distinguish siliphos-type media from ordinary sodium tripolyphosphate?
Usually yes, because the degree of condensation changes the P–O–P band pattern in the 700–800 cm⁻¹ region and shifts the 900–1150 cm⁻¹ envelope. The distinction is far more reliable when you compare against reference spectra of both materials measured on your own instrument under identical conditions, rather than against a generic library.
Do I need a commercial spectral library?
Not necessarily. Proprietary formulations are rarely in public libraries anyway. An in-house reference set built from your own accepted lots will usually be more useful for routine lot-to-lot comparison.
Is a 5 cm⁻¹ peak shift significant?
It depends on your instrument’s resolution and the repeatability of your preparation. Measure the same sample several times and across several days to establish your own variability. A shift smaller than that band of noise should not be treated as a material change.
Can FTIR prove a material is safe for drinking water?
No. FTIR shows molecular identity only. Drinking-water compliance depends on the exact product, extractables testing, local regulations, and the conditions of use, and must be documented by the supplier for the specific market.
How much sample is needed?
For ATR, only enough material to cover the crystal face — a few milligrams is generally sufficient for a good contact spectrum. For a KBr pellet, a small quantity is ground and diluted, and the ratio should be kept constant across the whole comparison set.
Talking through your comparison
If you are comparing incoming lots, evaluating a second source, or investigating why a filter behaved differently from expectations, the technical team at ENVO CHEMICAL can review the spectra and the application context with you. To make that conversation efficient, share the intended application, the source-water conditions you expect, the equipment type and contact time, the required product form and grade, your quantity and destination, and what you are specifically trying to verify — identity, batch consistency, or an alternative supply option. With those details, the discussion can stay focused on the material decision rather than generalities.
